
3. Connect your site and read your first numbers
In this tutorial you connect your website to Looku. After that, every page that someone opens on your site appears in your dashboard. Then we walk through the dashboard and what each part tells you.
We use a Next.js site on Vercel, the most common setup. Next.js on your own server works the same way; only the place of the settings differs (step 3). If your site is built differently (Node.js, Express, a static site behind Cloudflare), the connection step is in Node.js, Express, Cloudflare or your own; the dashboard tour below applies to every site.
You need: the installation from 2. Your first installation and its three settings, your site’s code on your computer, and access to its Vercel project. About 30 minutes.
How the connection works
Section titled “How the connection works”Next.js can run a small piece of code before each page, called the proxy (in Next.js 15 and older, the middleware). Looku’s connector goes there. When a visitor opens a page, the connector notes the page, where the visitor came from and what kind of device they use, signs this with your key, and sends it to Looku’s receiver. It does this after the page has been sent, so your site is not slowed down. Nothing is added to your pages and nothing is stored in the visitor’s browser.
Connect
Section titled “Connect”-
Copy the connector into your site. It is one file. Open
packages/next/src/index.json GitHub and select Download raw file (the download icon above the code). Save it in your project aslib/looku.js: make a folder calledlibnext topackage.jsonif there is none. -
Add the proxy file. Check your Next.js version: open
package.jsonand look at the number after"next". If it starts with 16 or higher, use the first tab below; otherwise the second. Create the file in the same folder aspackage.json(if your pages are insrc/app, put it insrc/and write"../lib/looku.js"in theimportline).import { NextResponse } from "next/server";import { trackPageview } from "./lib/looku.js";export function proxy(request, event) {trackPageview(request, event);return NextResponse.next();}export const config = {matcher: [{source: "/((?!api|_next/static|_next/image|.*[.]).*)",missing: [{ type: "header", key: "next-router-prefetch" },{ type: "header", key: "purpose", value: "prefetch" },{ type: "header", key: "sec-purpose", value: "(.*)prefetch(.*)" },],},],};import { NextResponse } from "next/server";import { trackPageview } from "./lib/looku.js";export function middleware(request, event) {trackPageview(request, event);return NextResponse.next();}export const config = {matcher: [{source: "/((?!api|_next/static|_next/image|.*[.]).*)",missing: [{ type: "header", key: "next-router-prefetch" },{ type: "header", key: "purpose", value: "prefetch" },{ type: "header", key: "sec-purpose", value: "(.*)prefetch(.*)" },],},],};Copy it exactly. The
matcherpart makes sure only real pages are counted, not images, Next.js’s own files or pages the browser loads in advance. If you already have a file with this name, see Connect a Next.js site for how to combine them. -
Add the three settings in Vercel. Open your project on vercel.com, go to Settings → Environment Variables and add these three, one at a time, with your own values. For each, choose only the Production environment and select Save:
Name Value LOOKU_ENDPOINThttps://looku.example.comLOOKU_SITE_IDmyblogLOOKU_SIGNING_KEYyour signing key The key stays in Vercel and never goes into your code.
Not on Vercel? On your own server, put the three lines in a file called
.env.localnext topackage.json, in the sameNAME=valueform. More ways: the Your own server tab in Connect a Next.js site.Want to test first? You can try it on your computer before publishing: put the three lines in
.env.local, runnpm run buildand thennpm start, and openhttp://localhost:3000. These are real page views from your computer; they are few and do no harm. (npm run devsends nothing on purpose. If port 3000 is in use, runnpm start -- -p 3001and open port 3001.) -
Publish. Commit
lib/looku.jsand the proxy file and push them to the branch Vercel publishes from (usuallymain), as you normally publish changes. Vercel builds a new version with the settings. (If you added the settings after pushing, open Deployments, select the latest one and choose Redeploy.) -
Check. Open your live site on your phone, click a couple of pages, and open the dashboard at home (the address from tutorial 2, for example
http://192.168.1.10:8788). Your visit is there within a few seconds; the default period is the last 24 hours.
Only the production site sends page views. Your own npm run dev and Vercel’s preview versions send nothing, so your
work on the site does not show up as visitors. Visits to addresses that do not exist (404) are counted as pages too, so odd
paths in the list are usually mistyped or old links;
Pages that do not exist moves them to a list of their own.
Bots are left out.
Nothing appears? Go through No page views appear; it checks each link in the chain.
Read your dashboard
Section titled “Read your dashboard”After a few days you have something to look at. These pictures come from a small web shop with about three months of data.
The front page
Section titled “The front page”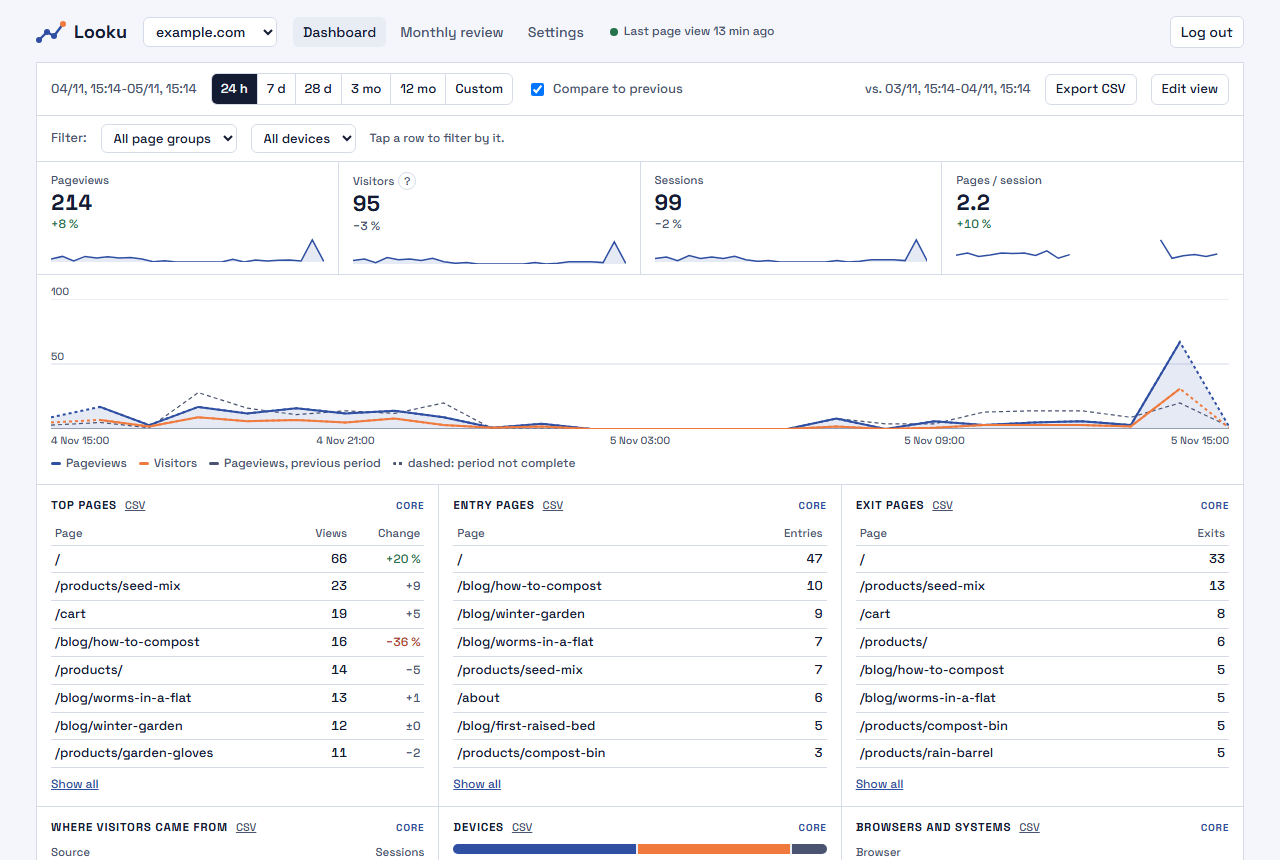
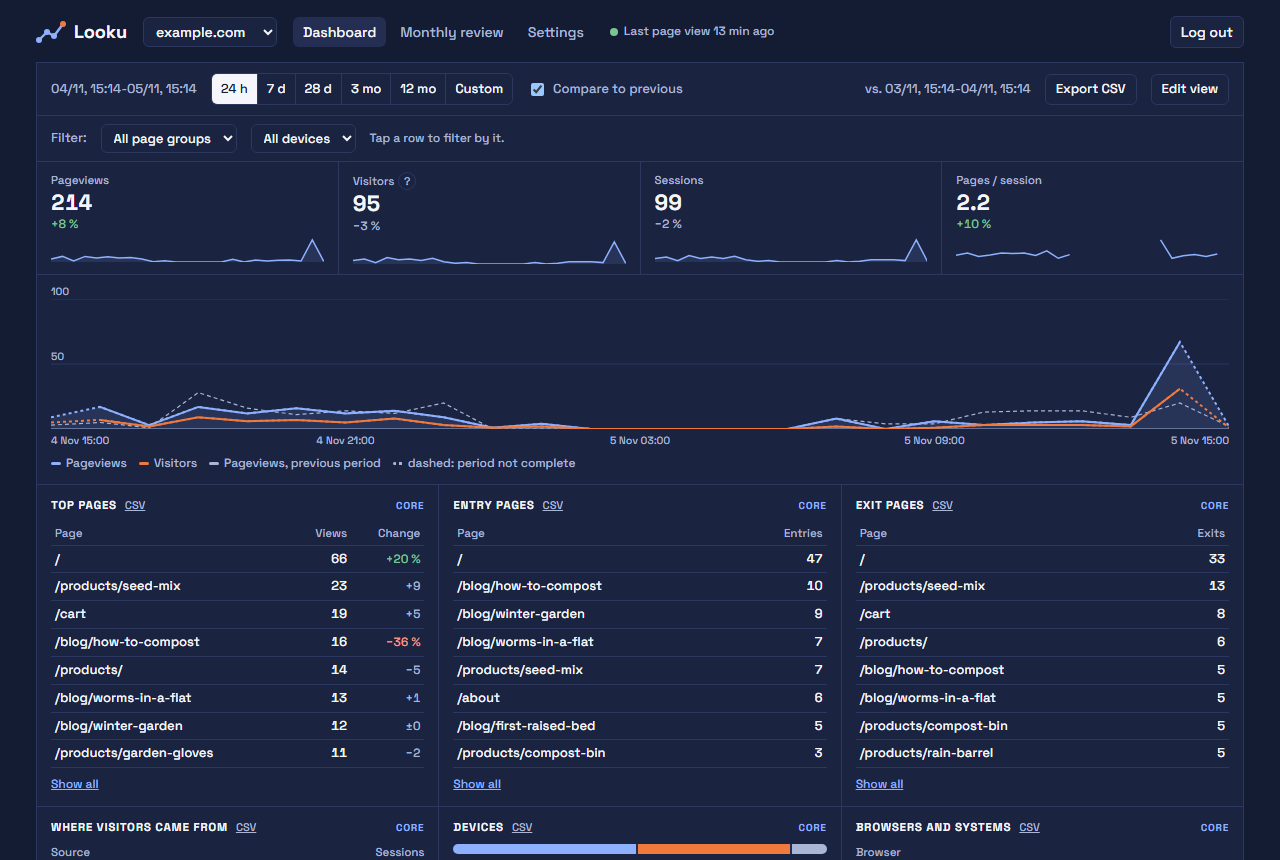
At the top you choose the period: the last 24 hours (the default, with the chart by the hour), 7 days, 28 days, 3 or 12 months, or your own dates. Compare to previous shows the change against the period before, both as percentages and as the thin grey line in the chart. With small numbers the change is shown as a count (+2) instead of a percentage, and changes under 5 % are grey, so that a quiet day does not look like news.
Point at the chart, or tap it on a phone, to see the numbers of each hour or day. A dashed end of a line means the period is not over yet, so a low last point is not yet a drop. Next to the menu, the header tells when the newest page view arrived; a site that has not sent any yet shows a short checklist instead of the numbers.
- Page views: how many pages were opened.
- Visitors: how many different people, as far as Looku can tell. Looku recognises a visitor for one day only, so someone who comes on three days counts three times in a month. This is the price of not storing anything that identifies people. Over several days the card also shows the daily average, and ? next to it explains this.
- Sessions: visits. A visitor who comes back after a break of 30 minutes starts a new session.
- Pages / session: how many pages a visit has on average.
Tap a row to filter by it. Tap a page, and the whole dashboard shows only that page’s views, including where its readers came from. A source, a campaign, a device or a country works the same way. The lists under Filter choose a page group, a campaign or a kind of device. Active filters are shown as chips: × removes one, and the browser’s Back button undoes the last change. The address keeps the period and the filters, so you can bookmark a view. Shop and content cards are not filtered and are dimmed while a filter is on.
Show all at the end of a card opens the whole list with search and sorting. Hourly shows the chart by the hour, and Export CSV downloads the numbers for a spreadsheet. When more than one module is on, the small label at the top right of each card (CORE, SHOP…) tells which module it belongs to. Cards with nothing in the chosen period are listed on one line at the bottom.
Pages and where visitors come from
Section titled “Pages and where visitors come from”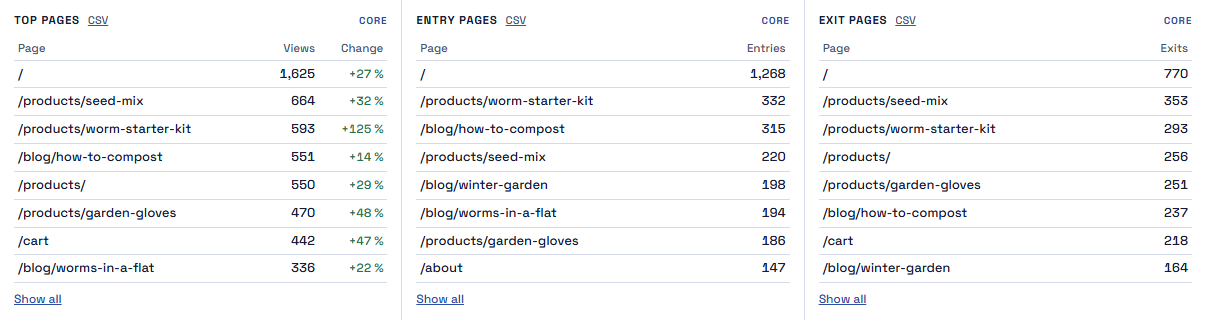
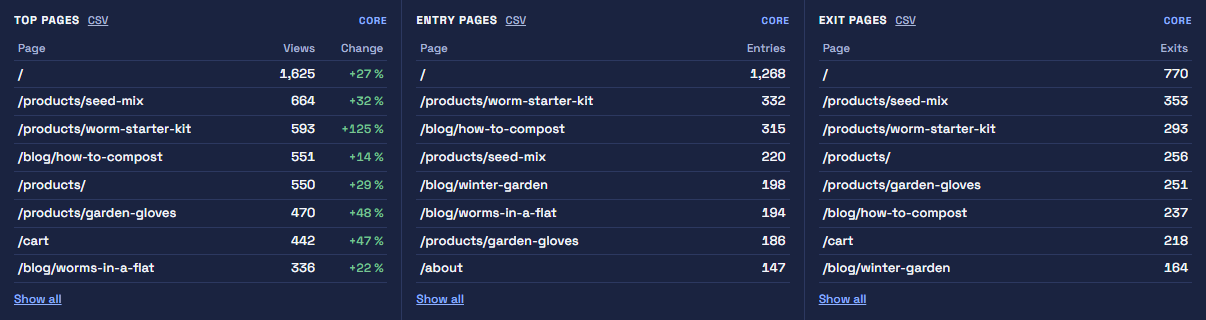
Top pages is the list most people look at first, and the percentage is the change from the previous period. Entry pages tells where visits start, which is often a blog post that someone found with a search engine, and Exit pages where they end.
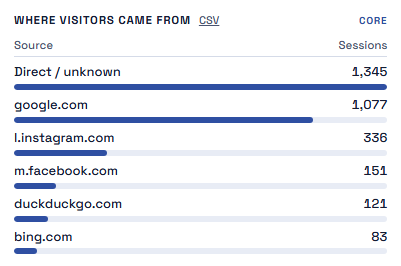
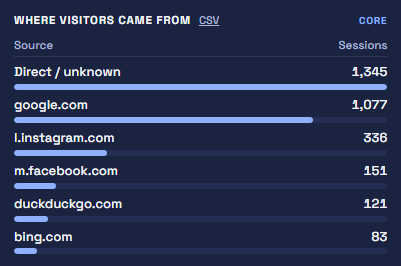
Where visitors came from lists the sites that sent visitors: search engines, social media and other sites that link to you. Direct / unknown means the visitor typed your address, used a bookmark, or came from an app that does not say where the visitor came from.
Devices and countries
Section titled “Devices and countries”

Phones, computers and tablets, browsers and systems, and countries. If most of your visitors are on phones, that is where your site has to work best.
Campaigns
Section titled “Campaigns”When you share a link in a newsletter or a post, add a campaign tag to it, for example:
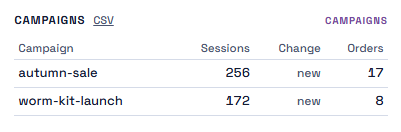
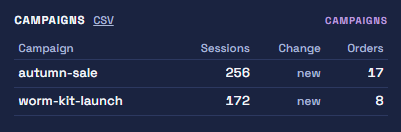
https://example.com/products/?utm_source=newsletter&utm_campaign=autumn-saleThe campaign names appear in the basic numbers right away, in the Campaigns (UTM) list. The campaigns module adds the Campaigns card below, with each campaign’s visits, whether it is new or has ended (in the Change column, which otherwise shows the change), and in a shop its orders. To turn it on, see What you can do with Looku.
The monthly review
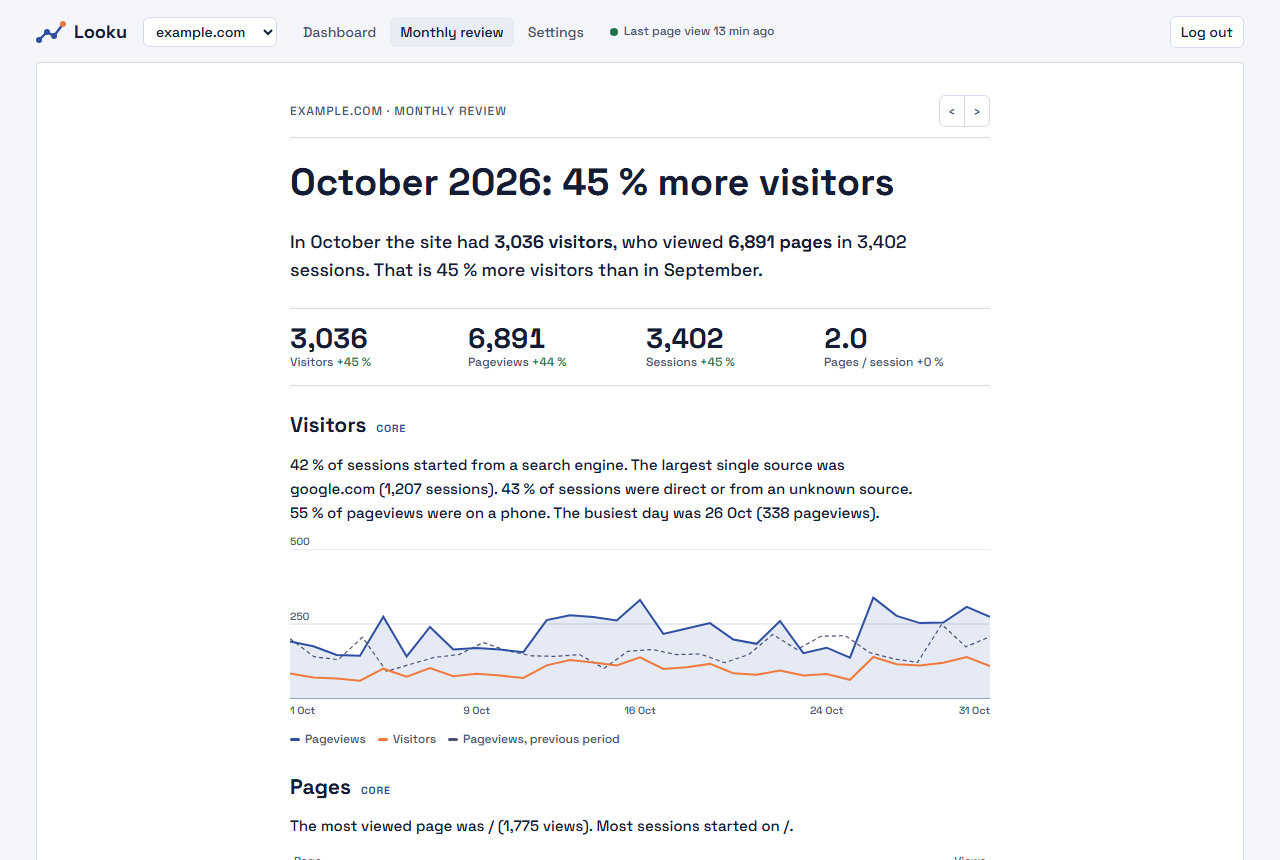
Section titled “The monthly review”Monthly review at the top of the dashboard tells the month in sentences: how many visitors there were and where they came from, and further down the page which pages rose. The same review can come to your email on the first day of each month.
Make it your own
Section titled “Make it your own”On the first visit the dashboard offers starting views: Everything, Simple (pages, sources and devices), Blog (pages, reading and sources) and, with the shop module, Shop (sales, conversion and the purchase path first). Choose one, or skip it with Everything; nothing else has to be set up.
Edit view on the dashboard changes the view in place, and you see the numbers while you edit:
- drag a card by its handle ⠿, or move it with the arrows,
- hide a card with ×, and bring it back from Hidden,
- choose the number of rows, a table or bars, the order (views, visitors or sessions) and whether the card is wide,
- choose the figures in the top row, for example orders and conversion next to visitors.
Save view keeps the view for everyone and on every device, Reset to defaults goes back to the start. In a shop, the Conversion, 7-day rolling card shows orders divided by sessions over the previous seven days at each day, so a single order on a quiet day does not swing the line. In the first days after sessions start, the window is shorter: one day, then two, up to seven.
Settings
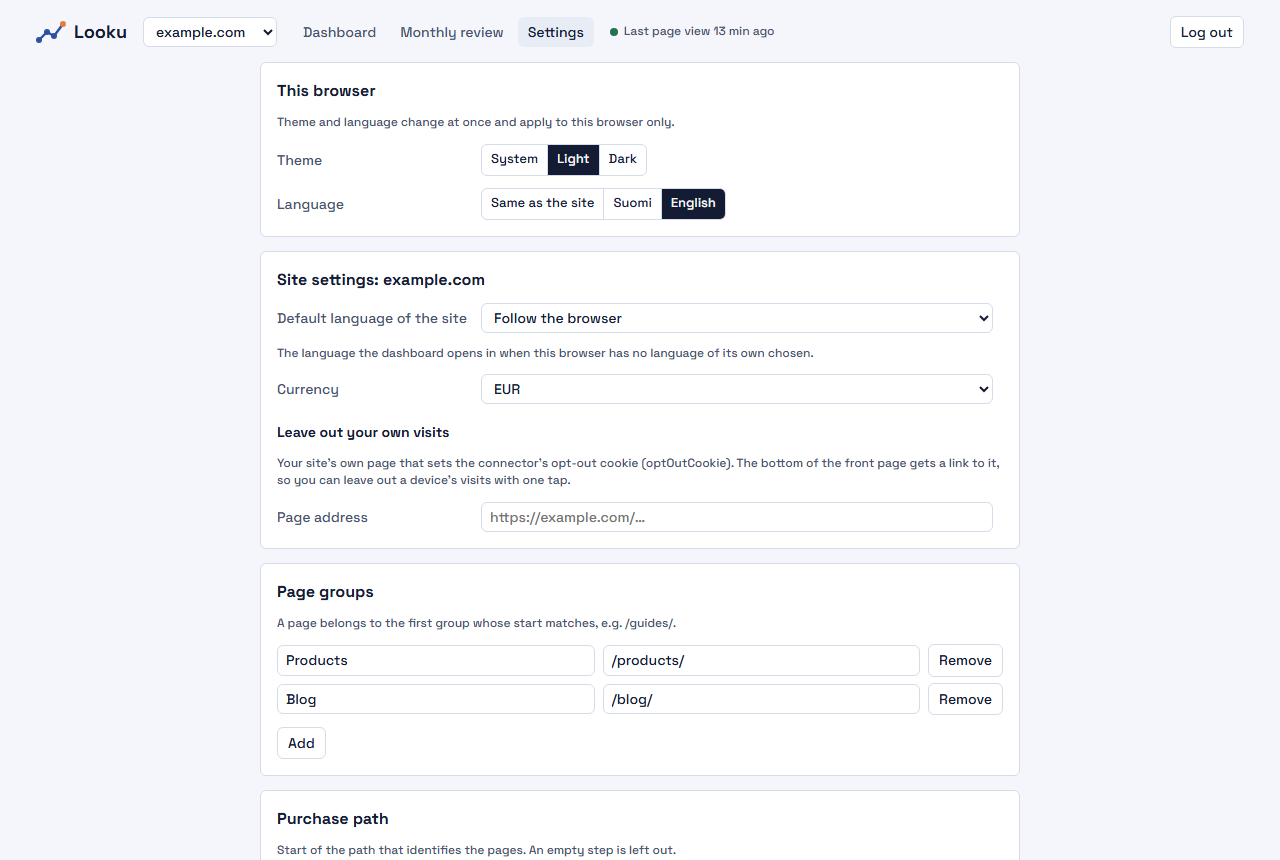
Section titled “Settings”In Settings, This browser sets the theme and language for this browser only, and they change at once. Same
as the site uses the site’s default language, which is set below for everyone. You can group pages, for example
all /products/ pages as “Products”, so that you see how each part of the site does. In a shop you also set the
pages of the purchase path and the currency here. When you change a site setting, a bar with Save appears at the
bottom of the screen, and leaving the page with unsaved changes asks first.
Where to go from here
Section titled “Where to go from here”- What you can do with Looku: turn on campaigns, shop orders, reading time or the monthly email.
- Backups and updates: set up a daily backup now, while you remember.
- Privacy and the law: update your site’s privacy notice; the page has a template.